Archive for the ‘Big Data’ Category

Big Data: string similarity – match, mismatch and gap scores come into play (Needleman-Wunsch measure)


Imagine big data flowing in your system. Reviews, articles, blogs, comments, logfiles… day by day, unpredictable quality. And you there in the middle trying to solve:

  • Is Dave Smith in review the same as David Smith in article?
  • Is Davod R. Smith the same as Daivd Robert Smyth?
  • Could it be Davod Snoth in comment is the same as Davidd Smith in review? (notice I and O, N and M near on the keyboard)
  • Is Professor David Robert Smith-Smithsson in one article the same as David R. Smyth in another article?
  • Could it be Dvae Smitt is the same as David Smith?
  • Is Dav1d R0berl 5mith (it might be OCR output) the same as Daivd R. Smith?
  • Is Daid Smith the same as Davids Smits (latvian article)?
  • Is his job address Kr Barona street 117 the same as 117, Krisjana Barona street?

Scientists have worked quite hard to give a helppful hand, and I will briefly overview some of string similarity measurements and methods because I think it is nice to know that no magic – pure logic.

One blog post earlier I invested a time to teach myself and you, dear readers, to calculate EDIT DISTANCE. It was worth it because the next measure I will discuss about, is Needleman-Wunsch Measure developed by Saul B. Needleman and Christian D. Wunsch in 1970.

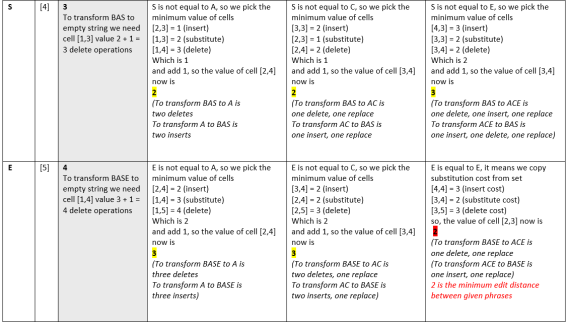
I will remind that in EDIT DISTANCE or LEVENSTEIN distance case we had a tangible result: resulting number was count of insert/delete/substitute operations needed to transform one string to another.

Here are two strings. We, humans, might think it is a high change the object is the same – David Smith. When we see EDIT DISTANCE value 8 for 14 symbols long string, it signalizes that the strings are not similar – and technically they definitely are not:

Measures_Leven_example_1

https://andrew.hedges.name/experiments/levenshtein/

Similarity measure is 1-8/max(14,18) = 1-8/18 = 0.55 – we have to have really loose boundaries to consider these strings similar using Levenstein distance :)

Let’s have a look what some other scientists have done!

Needleman-Wunsch measure you will hear mostly within biology context, comparing DNA sequences. I will make its explanation more human centred, using words.

Needleman-Wunch measure is mathematically proven to find the fewest number of mutations of two sequences, identifying matching parts and the changes needed to transfer one sequence into the other.

Please note that now we will talk about the measure. This is not tangible count of neither I/D/S operations, nor parrots, symbols or atoms. The benefit of using a measure is ability to compare. We will use the same method of comparison to different strings and will use this output measure to evaluate bad-good-better-best matching strings.

I will give also lot of examples not to just another theoretical blablabla. I can’t thank enough this site: http://experiments.mostafa.io/public/needleman-wunsch/

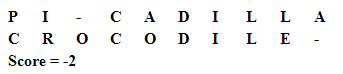
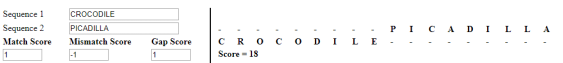
Usually you’ll use samples from biology like TCGAC and TCATA but I’ll use words. Let’s have a look using the same PICADILLA and CROCODILE.

The basic idea within Needleman-Wunsch measure is advanced scoring system which is used in calculation rules:

  • match score. If letters match, we assign them a matching score, usually defaulted as is 1, Thus we will reward the match of symbols – we will increase their rating
  • mismatch score. If letters don’t match, mismatch score is usually defaulted as -1. Thus we will punish the mismatch of symbols – we will decrease their rating
  • gap penalty. The gap score or gap penalty is usually defaulted as -1. Thus we will define, what is preferred: a gap (empty space) or a mismatch (another symbol).

Let’s start with the defaults for scores in our example – I’ll change them later and show you the impact:

  • match score 1 (you see, that I like match the most)
  • mismatch score -1
  • gap penalty -1 (you see, I have set them equal – I don’t care, is it a gap or a mismatch)

The idea of dynamic calculation of Needleman-Wunch measure is similar to EDIT DISTANCE, just prepare a matrix with both strings and follow predefined (slightly different from edit distance) rules and take the maximum (in Edit distance we took the minimum) value from one of left, diag, up.

Measures_Picadilla_0

In addition to EDIT DISTANCE, we must set initial values in matrix – add gap penalties, see the grey line and column.

Measures_Picadilla_01.PNG

To calculate the first cell, the green :

  • add the gap penalty to upper cell value
  • add the gap penalty to left cell value
  • in diagonal, we must use match and mismatch parameters
    • If letters do not match, add the mismatch score to the diag value
    • If letters match, add the match score to the diag value
  • When doing that, also put a note, from which cell the final value was taken as max from three. If we can take value from more than one cell, mark them all.

Fill the empty row and empty column (initialize the matrix), only after it we can do the crosses.

Well, you saw the idea, now let’s have the whole matrix done (I am using http://experiments.mostafa.io/public/needleman-wunsch/):

Measures_Picadilla_2.PNG

Now, what the result means? As we have defined, we consider mismatch score to be the same as gap score and we see that the result is calculated to have the strings aligned in the best optimal way: there are

  • two gaps -O, A-
  • four mismatches P-C, I-R, A-O, L-E
  • four matches C-C, D-D, I-I, L-L

Measures_Picadilla_3.PNG

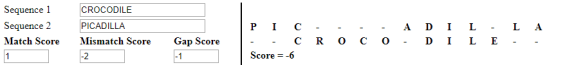
What happens if we change the scoring system? Let’s switch that

I prefer gap over mismatch:

  • match score 1 (you see, I still like match the most)
  • mismatch score -2
  • gap penalty -1 (you see, I now prefer gap better than a mismatch)

Measures_Picadilla_4.PNG

Here you the impact when I consider gap is better than mismatch:

  • ten gaps
  • no mismatches – because we prefer gaps!
  • four matches

Measures_Picadilla_5

Let’s continue playing with the scoring system. Let’s set that

I don’t care for gaps and they are as nice as matches:

  • match score 1 (you see, I still like match)
  • mismatch score -1 (I still don’t like mismatch)
  • gap penalty 1 (hehe)

and – voila! – algorithm used in that webpage just gapped all the symbols because I set in scoring system I don’t care for gaps.

Measures_Picadilla_6

Let’s go further! Let’s penalize gaps very hard.

I really do not like gaps

  • match score 1 (I still like match)
  • mismatch score -1 (I still don’t like mismatch)
  • gap penalty -4 (so I think gap is a very, very bad)

And look, we have strings aligned and there are no gaps at all because I have scored that mismatch is better than the gap.

Measures_Picadilla_7

Let’s have a look on our professors now.

Default scores:

Gap is equally bad as mismatch

Measures_Picadilla_9.PNG

Ha, the Needleman-Wunch measure result is better than

Measures_Picadilla_10

Gap is better than mismatch:

Measures_Picadilla_11

Still better than

Measures_Picadilla_12

I really do not like gaps

Measures_Picadilla_14.PNG

Heh, professors are much worse because I have no chance to avoid gaps and are having these penalties.

Measures_Picadilla_15.PNG

Here I will note that from the table with arrows we can track back alignment path, and, when we have two arrows, from algorithm point of view any path is OK. For example

Measures_Picadilla_16.PNG

Notice the score is still the same but alignment differs. Calculation result is the same, either we choose replace E and gap D or gap E and replace D. If you see calculators in web pages where only one result is shown it means their programmers have voluntarily built in additional logic, preferring something.

Needleman – Wunsch algorithm is neutral. Programmers are not.

Measures_Picadilla_17.PNG

Now some bonus to Needleman – Wunch measure: we may add

additional scoring matrix to reward similar symbols like O and 0.

You may notice, the letters I and O are near on the keyboard, also letter O is similar to number 0, and lowest letter l is similar to I. We may define that mismatches (I and O) and (O and 0) and (L and I) are not the same bad as, eg, (A and M) mismatch. This is done by adding one more scoring lookup table for mismatch score like

Measures_Picadilla_18.PNG

here I have set that I do not penalise I and O, O and 0, L and I mismatches at all, and penalty is bigger for A and M mismatch. In this way you will easily find out that

  • Davod and David
  • Dav0d and Davod
  • AIA and ALA (aIa and ala)

are very similar.

As you see, I haven’t added that Dav0d and David are very similar – then I must add one more mismatch value. Now I will not penalise also I and 0 mismatches. As 0 and 0, I give them higher score because I still prefer the real match over my pseudo matches.

Measures_Picadilla_19.PNG

Hmm, I think I also should add 1 and l mismatch not to be penalized. Then I might decide also 5 and S, 6 and G and so on – it depends on my software, my data and my business.

Got the idea?

See the example now.

Let’s compare DAVOD1 with DAVIDL.

I drafted an additional MISMATCH matrix where I define some exceptions to default mistach score. I will consider

  • O and 0 the same score as match, L and 1 as match
  • I and O (they are near on keyboard), I and L, I and 1 near as match

NW-3

Here is the my refined result according to my additional score matrix – Needleman-Wunsch measure is 11

NW-2

And here it would look like if only defaults used – the Needleman-Wunsch measure is 6.

You see my refined result is considered significantly more similar (max possible would be value of 12 and my refined result had 11)

NW-1

See you in next posts, there are a lot of similarity measures yet.

Disclaimer

This blog is solely my personal reflections.
Any link I share and any piece I write is my interpretation and may be my added value by googling to understand the topic better.
This is neither a formal review nor requested feedback and not a complete study material.

Big Data: one of string similarity measures: EDIT DISTANCE (or Levenshtein distance)


Have you ever thought how does spellchecker, search engine, translation, speech recognition etc. software find replacement options for the word you entered?

User typed:

Crts

What would be YOUR software action? Correct to

  • Arts?
  • Cats?
  • Carts?
  • Cuts?
  • Cryptos?
  • Crots?
  • Rats?
  • Crtl?
  • CRC?

I hope, you’ll answer me – hey, it depends! Of course, it depends :) but how does your software know it? Is there some magic? Ah, no, only logic…

Here are some examples again: Google; Word + language English, Word + language Latvian

Crts-googleCrts-word-lvCrts-word-en

Have you ever wondered how are the data found which refer to the same real-world objects? Schwarzenegger, Svarceneger, Švartcnegers, Švarcenegers – why is the searching software so smart and understands that we are looking for the old, good Arnold?

Svarcene-google.png

Similarity measures

One of similarity measures – not the only one! – is Levenshtein distance, named after the Russian scientist Vladimir Levenshtein, often called also EDIT DISTANCE or minimum edit distance, the operation count needed to convert one phrase into the other. If you have enough patience to read this post, you will be able to calculate the Levenshtein distance yourself or at least understand jow the online calculators work.

The smaller is edit distance, the higher is the chance that words are similar.

NB: outside this blog entry there are other measures – Needleman-Wunch, Smith-Waterman, Jaro, Jaro-Winkler, Affine gap etc.

Have you ever played to see when Google switches to offering other words and trying to guess the reason?

Arnold_google

Change a bit and have different set:

Ceneger-google

Have you been playing with spellchecker options? I enjoy guessing algorithms and logic behind.

Despacito-spellcheck

Espacito-spellcheck

If you work in data integration area, this type of tasks might be one or your “business as usual” tasks – recognizing that customer “David Smith” is the same as “David R. Smith” and “Davod Smit”. Are addresses “K. Barona 117”and “117, Krisjana Barona street” the same?

The general term is string matching challenge.

Look, different software, but the option offered to Picadilla is the same :)

The minimum edit distance is the minimum number of editing operations (insert, delete, replace) to transform one string into the other (doing that vice versa, the second string will be converted back to the first).

Edit Operations

Deletion, insertion, and replacement (or sometimes called substitution) operations of characters may have assigned different weights. The usual choice is to set all three weights to 1, however different weights allow more flexible search strategies in lists of words. For example, you may consider that substitution costs 2. Or you may prefer insertion to deletion, by setting insert weights 1, delete weights 2.

  • Insertion weight = 1
    • Cts -> Cats : edit distance = 1
    • Cts -> Cites : edit distance = 2
    • Cts -> Cities : edit distance = 3
    • Cts -> Citizens : edit distance = 5
  • Deletion weight = 1
    • Carts -> Cats : edit distance = 1
    • Carts -> Car : edit distance = 2
    • Carts -> as : edit distance = 3
    • Carts -> a : edit distance = 4
  • Substitution weight = 1
    • Crts -> Cats : edit distance = 1
    • Crts -> Cups : edit distance = 2
    • Crts -> Avio : edit distance = 4

If we change weight – eg, by doing that we might rank up similar words where only delete required:

  • Substitution weight = 2 (consider it as equal to insert + delete)
    • Crts -> (insert a, delete r) Cats : edit distance = 2
    • Crts -> (insert up, delete rt)Cups : edit distance = 4
    • Crts -> (insert Avio, delete Crts) Avio : edit distance = 8

Full replacement – too easy for us

What we can see quite obvious, is that full replacement works always.

  • QQQ (length 3) -> SYNCHRO PHAZOTRON (length 17) max edit distance is 3 deletes + 17 inserts = 20 operations
  • PSYCHO (length 6) -> SYNCHRO PHAZOTRON (length 17) max edit distance is 6 + 17 = 23. But I see some characters are the same!
  • ROTORON (length 7) -> SYNCHRO PHAZOTRON (length 17) max edit distance is 7 + 17 = 24. As we see, all characters are the same, is it really 24 operations necessary?
  • STUDENT (length 7) -> TUDENTS (length 7) max edit distance is 7 + 7 = 14. Wait, it can’t be true, we just need to move one letter! Does the computer know this?

It means, if we need just to change strings, no worries, delete + insert (overwrite) and forget edit distance at all.

Add value by understanding

If we are going to add value, let’s understand the minimum edit distance. It is not just ANY sequence of operations to get the desired result – transformed one sting to another. This is THE MINIMUM number of operations needed. How can we find it? I’ll show you both guessing method and scientific method.

Let’s start with a very simple example. What’s the edit distance between

  • ACE
  • BASE

I believe you see the answer right now and say – only two operations needed, insert B and replace C to S. I just wanted to start with this very simple example because scientists for several decades were trying to find out the faster way how to find the edit distance, without calculating values for the whole matrix. They just believed – as I did – there should be a faster way instead of calculating the whole matrix! You will find the sad truth at the very end of this post.

So, maximum operations needed would be 7 (delete 3, insert 4). But we are looking for the minimum. To find it in a scientific way, we must fill a matrix, table cell by cell. This matrix size is length of phrase ACE multiplied by length of phrase BASE, in our case 3*4 = 12 cells.

By the way, here you see quadratic time concept: when the length of phrase increases a little, the number of cells in matrix increase much more lot.

If our second phrase will change by 1 symbol from BASE to BASIC, we will have 3*5=15 cells. 1 symbol, 3 new cells.

If by 4 to BASEMENT, then 3*5=24 cells. 4 symbols, 12 new cells. Imagine that now with larger phrases up to thousands… billions of symbols like in DNS sequences.

To find the minimum edit distance, we must fill the table cell by cell for three operations

  • INSERT operation, we’ll consider edit cost (weight) as 1
  • SUBSTITUTE (replace), we’ll consider edit cost (weight) as 0, if letters are equal, and 1, if letters are different
  • DELETION, we’ll consider edit cost (weight) as 1

Let’s fill the table

So, we draw a table and first we fill so called base columns with operations count

  • Transform empty string into string 1, in our case ACE (create string from nothing)
  • Transform string 2, in our case BASE into empty string (erase string)

Then we follow rules, filling the other cells:

  • If letters are not equal, we pick the minimal value of three cells: upper (insert), diag (left-upper (substitution)), left (delete) and add 1 operation (see three blue cells example for green cell)
  • If letters are equal, we copy over substitution cost from left-upper cell.


ACE-BASE-Table1

ACE-BASE-Table2.PNG

Let’s look at another, more cats and zoo related example

Are these words similar? when user typed Picadilla, shall we offer to search for similar pets like Crocodile? a la ‘you might consider searching crocodile’, Did you mean pizza delivery’? Did you mean Piccadilly Circus?

Which is more like PICADILLA:

  • CROCODILE or PICCADILLY?
  • Or CACTUS? Is Cactus similar at all?

Let’s start investigation, mr. Inspector Caps, if the words PICADILLA and CROCODILE are similar at all.

  • As we can set the rules ourselves, we will consider the strings are similar if minimum edit distance is less than 70% of string average length, in our case less than 70% from 9 is between 0..6. It is obvious for US the distance is not 0, because strings are not similar. But computer still needs to find it by following predefined logic.
  • We will also use the official similar measure value s(x,y) = 1 – d(x,y) / [max(length(x), length(y))]

We, humans, face there many options now in front of us to transform the words. As I wrote, we always might delete one string and insert another. But we will not do this. We will try think smart. So. Hmm, should we start as

  • substitute P -> C
  • substitute I -> R
    • CRCADILLA

Or maybe better start

  • Delete P
  • Delete I
    • CADILLA

Hmm. Ok. Let’s do it one way:

PICADILLA

CROCODILE

  • substitute P -> C (1 operation) CICADILLA
  • substitute I -> R (1 operation) CRCADILLA
  • substitute C -> O (1 operation) CROADILLA
  • substitute A -> C (1 operation) CROCDILLA
  • substitute D -> O (1 operation) CROCOILLA
  • substitute I -> D (1 operation) CROCODLLA
  • substitute L -> I (1 operation) CROCODILA
  • hurrah, L = L
  • substitute A -> E (1 operation) CROCODILE

Totals: 8 operations.

We see 8 is enough. But can we say 8 is the minimum edit distance?

Let’s try another way.

PICADILLA

CROCODILE

  • delete P (1 operation) ICADILLA
  • delete I (1 operation) CADILLA
  • hurrah, C = C
  • insert R (1 operation) CRADILLA
  • substitute A -> O (1 operation) CRODILLA
  • insert C (1 operation) CROCDILLA
  • insert O (1 operation) CROCODILLA
  • delete L (1 operation) CROCODILA
  • substitute A -> E (1 operation) CROCODILE

Heh, again 8. But I am quite sure there MUST be shorter distance. You know, intuition etc.

Let’s think.

Let’s see the letters we have:

PICADILLA

CROCODILE

Length of words is equal (9).

I have to do something with 6 outstanding letters PIAILA or CROOIE. Why did I have distance 8 before? Because I was not thinking at all.

Now:

  • substitute P -> I (1 operation) CICADILLA
  • substitute I -> R (1 operation) CRCADILLA
  • insert O (1 operation) CROCADILLA
  • substitute A -> O (1 operation) CROCODILLA
  • substitute L -> E (1 operation) CROCODILEA
  • delete A (1 operation) CROCODILE

Voila! We did it in distance 6. You might ask is it that simply – edit distance equals unmatching letters? No, it is not as simple, unfortunately.

Proof

And now let’s fill The Matrix similarly we did before to prove if we are correct.

Pica-croco-table1.PNG

Pica-croco-table2.PNG

Voila!

  • By our voluntarily definition the words PICADILLA and CROCODILE are similar
  • By official s(x,y) = 1 – d(x,y) / [max(length(x), length(y))] : s(PICADILLA,CROCODILE) = 1 – 6 / [max(9, 9)] = 1 – 6/9 = 0.33 , ahemm, not too similar….

As you previously saw, I found the shortest way in third guessing attempt because I did on my intuition. Computers have no intuition. Can I afford this type of guessing if I must transform long strings, eg, billions of symbols long?

I played a bit with online distance calculators.

  • Dillapica -> Crocodile, distance = 8
  • Alpilidac -> Crocodile, distance = 9

the more of matching letters are not in the same sequence, the longer distance is. In our case matching letters are CDL, so when I put them in opposite order I get the longer distance, in our case max long I could achieve was 6 + 3 = 9.

Hmm, it would be interesting to write a code for fun which calculates longest possible edit distance between two strings when the letters are in different order :)

Is word CACTUS similar to PICADILLA?

Cactus-Picadilla.PNG

1) Remember, we voluntarily defined similarity as distance is less than 70% of string average length, in this case 70% of (6 + 9)/2 = 5.25, so we will consider the words similar, if minimum edit distance is 0..5. We see the distance is 7 – not similar.

2) By official s(x,y) = 1 – d(x,y) / [max(length(x), length(y))] : s(PICADILLA,CACTUS) = 1 – 7 / [max(9, 6)] = 1 – 6/9 = 0.22 again, not similar.

Hamming distance

One of metrics, slightly similar to Edit distance, is between two strings of equal length is the number of positions at which the corresponding symbols are different. Other words to describe, are – minimum number of substitutions (replace) to transform one string to the other. Online calculator to play: http://valjok.blogspot.com/2015/08/hamming-distance-online.html

Hamming distance for {PICADILLA,CROCODILE} is 8. (Edit distance is 6)

Conclusions:

  • words PICADILLA and CROCODILE are more similar then CACTUS and PICADILLA by any of measures we used
  • we may define our rules where words PICADILLA and CROCODILE are considered similar. Following the same rules, words CACTUS and PICADILLA are not similar, but, if we have a business need, we could define even a measure boundaries where these words are considered being similar.

And now the sad truth: Arturs Backurs, absolvent of LU CS Faculty and MIT graduate proved in this thesis that For 40 years, computer scientists looked for a solution that doesn’t exist.

“For 40 years, computer scientists have tried in vain to find a faster way to do an important calculation known as “edit distance.” Thanks to groundbreaking work from two researchers at MIT, they now know the reason they’ve continually failed is because a faster method is actually impossible to create.”

Disclaimer

This blog is solely my personal reflections.
Any link I share and any piece I write is my interpretation and may be my added value by googling to understand the topic better.
This is neither a formal review nor requested feedback and not a complete study material.

Big Data: HADOOP ecosystem. There is no one ‘hadoop.zip’ to install


When I was a kid, there was a saying – we say ‘the Party’ and mean Lenin, we say ‘Lenin’ and mean the Party. Today we say Big Data and mean HADOOP which is presumed to be used for processing of 50% of enterprise data all around the world – hundreds to thousands of nodes and petabytes of data is nothing special.

I heard about 8500 computers and 100 petabytes HADOOP cluster in one of training videos.

HADOOP is everywhere: social media, searching tools, government, finances etc. Yahoo, Facebook, Amazon, eBay, IBM, American Airlines etc. P.S. this also mean very high volume of job postings. HADOOP admin salary about 90k – 120k USD/year, developer/data scientist 60k – 150k USD/year.

There is no one “hadoop.zip” which you can download and install and happy having HADOOP.

In one sentence: HADOOP framework is the collection of open source LINUX based software to enable big data flow to be split and processed locally by using parallel, distributed (map-reduce) algorithms across many (one to thousands) low-cost computers and application layer (HDFS) handling hardware faults. HADOOP started its raise since ~Y2003.

Often referenced as ‘HADOOP ecosystem’, ‘HADOOP umbrella’, ‘HADOOP cluster’, it is addressing:

  • lots of data flowing in at a very high speed,
  • large and increasing volume,
  • variety of unstructured, different data – logfiles, videos, messages, records, comments, chats
  • if you lose a computer, it automatically rearranges and replicates the data – no data loss

HADOOP supports running applications on Big Data like social networking portal or recipes portal or trend analytics of retail.

It took a while to understand that Hadoop is like data batch processing fabrics in backoffice and is a set of tools, each strong in a particular area. Outside the HADOOP there are frontoffice applications who needs something to be done with data – queried, stored etc, eg, searching device or TOP 10 most sold books this week genre sci-fi or retrieving Facebook message. These applications send their tasks to HADOOP as tasks or jobs to be queued and performed by map reduce and the results to be sent back to the calling applications. This is done on data stored in HDFS file system.

Examples of applications where HADOOP is behind the scenes:

  • Mining of users behaviour to generate targeted advertisements and recommendations (Apache Mahout)
  • Searching and grouping documents, based on certain criteria
  • Searching uncommon patterns to detect fraud
  • And, of course, Facebook which runs the world’s largest Hadoop cluster. Your messages, likes, shares and comments, they are there, in Facebook data centers and HADOOP. When their previous messaging platform was running our limits they spent weeks testing different frameworks, to evaluate the clusters of MySQL, Apache Cassandra, Apache HBase and other systems. Facebook selected Apache HBase, one of HADOOP family.

Programmers love HADOOP because they do not have to worry about, where data are, what if computers fails, how to split big data and how to break down tasks. If a code works for a megabyte file, it will work for hundreds of gigabytes. If it works on one computer, it will work on 8500 computers. it’s HADOOP business – scalability.

Teamwork. No superhero.

If we use our classical enterprise mindset these data would be handled by a one supercomputer. But everything has its limits, even supercomputers, shall it be processing speed limit or disk space limit.

HADOOP splits and conquers, combining “weakness” of each separate computer (low price, so called commodity hardware)  into a powerful engine. You can add more and more computers (scalability) when your data are growing or requirements changing. The bright side of HADOOP scalability is that count of computers is linear to processing speed: to double the processing speed double the number of computers.

  • Data processing part of HADOOP is map-reduce.
  • Data storing data is HDFS (HADOOP distributed file storage).

Slaves

Computers incorporated into HADOOP framework are called slaves. Each has processes running on it:

  • Tack Tracker: responsible for performing the piece of task assigned to this computer
  • Data Node: responsible for managing the piece of data given to this computer

Master (or masters)

As word slaves might have made you think, they have a master. NB: Master computer is not a supercomputer, it is one of commodity hardware like others. This node has the same processes running as each slave – tack tracker and data node, and has yet two additional processes running:

  • Job Tracker to break tasks into smaller pieces, send to tack tracker processes, receive results, combine results and send the result back to the calling application
  • Name Node to keep an index which data are residing on which node (computer). It tells the calling application which node stores the data required, and the application contacts this node directly, it is not depending on name node to return the dataset. Actually, data flow itself never goes through Name Node, it only points to the storing Node.

Task tracker and Job tracker are puzzle pieces of Map Reduce component.

Name Node and Data Node are puzzle pieces of HDFS.

HDFS

HDFS software is built presuming that hardware fails will definitely happen. It is called built-in fault tolerance.

By default, HADOOP maintains three copies of each data file in different computers. Once a node fails system keeps running and if a node is later restored then HADOOP maintains data copied are spread to this node.

Interesting that fault tolerance applies no only to classical “disk failure” but also to failure of task tracker processes. In case it happens, Job tracker asks another node to perform that job.

Does it sound like Master Computer is single point of failure now?

HADOOP has solution also for Masters failures. The tables masters store data indexes (which data files are on which nodes) are also backed up to different computers. HADOOP can be set to have more than one master where backup master overtakes in case main master fails.

When trying to understand that universe you feel like in the Bold and the Beautiful where everyone has married everyone else for several times and have several backup wives :D

Some of tools within HADOOP ecosystem  – be aware, list is growing

Apache HIVE: data warehouse – query, analysis, summaries. It takes a SQL like language, then converts it to Pig and then to Map-Reduce. Unline SQL, querying HIVE always inserts the results into a table.

Facebook uses this up to 90% of their computations.

I wrote a HIVEQL query which finds all Picadilla page views referred October 2017 by my cat farm main competitor BestCats.com

INSERT OVERWRITE TABLE bestcats_refer_picadilla
SELECT picadilla_page_views.*
FROM picadilla_page_views
WHERE picadilla_page_views.date >= '2017-10-01' 
AND picadilla_page_views.date <= '2017-10-31' 
AND picadilla_page_views.url_referrer like '%bestcats.com';

 Apache HBASE: people need to read and write their data in real-time. HBASE meets that need: it is a noSQL big data store, providing real-time read/write access to large datasets in distributed environment (as all our data are spread across HADOOP cluster).

HBASE can be accessed by Hive, by Pig and by Map Reduce, and stores the data in HDFS.

Facebook messaging is one of most famous examples of HBASE users. When you send a message to your friend in Facebook, this message actually is an object in an HBASE table. The more messages you send the more nodes Zuckerberg has to add to FB Cluster :)

HCatalog: HBASE table metadata storage, pulled out of HBASE and treated as a separate project for different data processing tools — Pig, MapReduce — to access it, read and write.

Apache Zookeeper: a centralized service for maintaining configuration information. It also stores some of HBASE metadata.

Apache Mahout: machine learning targeted advertisements and recommendations. It will scan the data in system and recommend ‘movies you might like’ or ‘places for you to explore’. It lets you write map reduce applications, focused on machine learning.

Apache Pig: tool for analysing data. It is a high-level language for programming Map-Reduce logic (Pig Latin – similar to SQL). Programmers write high level description and Pig translates it to machine code for Map Reduce and runs that map reduce.

Yahoo experience was that 50% of tasks are written by using Pig instead of direct Map Reduce coding by programmers.

I wrote a very simple script which takes all comments from my imaginary cats site and filters out mentions of my favorite cat Picadilla into a new file picadilla_mentions.

This action might be sent to HADOOP when you open my cats site page and click on Picadilla photo. Then you could have a page opened by telling what a famous cat she is:

catnotices = LOAD 'cats_site_comments';
picanotices = FILTER catnotices BY $0 MATCHES '.*PICADILL+.*';
STORE picanotices INTO 'picadilla_mentions';

Apache Oozie: workflow scheduler to manage Hadoop batch map reduce jobs run – eg, run this job on this schedule, with this interval etc. Other features, like it can trigger a map reduce job when necessary data appear

Apache Flume: collecting large amount of log data and providing data model for log analytics. Load log data into HDFS and process by map reduce.

Apache Scoop: tool for writing map reduce applications to transfer bulk data between Apache Hadoop and structured databases, like RDBMS (Oracle, for example)

Roles

HADOOP administrators and user roles are overlapping. In general they perform:

  • Installation
  • Monitoring
  • Tuning (users help to do that)

Users perform:

  • Design and coding apps for certain objectives (admins help to do that)
  • Import/export data
  • Working with HADOOP ecosystem tools, connectors

Pricing

HADOOP open source software is for free.

Since Y2006 HADOOP software is distributed under Apache Software Foundation, an American non-profit corporation formed as a decentralized open source community of developers. The software they produce is distributed under the terms of the Apache License and is free and open-source software. The idea of license is that no particular company controls the HADOOP.

ASF makes money from donations, sponsorship, running conferences,

HADOOP ecosystem vendors use different pricing models: service per node, per terabyte, subscription, hardware plus software deals, selling specialised connectors, selling cloud services and an interesting concept freemium –  free usage till a threshold limit.

Disclaimer

This blog is solely my personal reflections.
Any link I share and any piece I write is my interpretation and may be my added value by googling to understand the topic better.
This is neither a formal review nor requested feedback and not a complete study material.

Big Data: basics of Time series databases


Topic, painfully familiar for me as a data warehouse servant: data changing over time. Ticket valid from – to, Policy effective from-to, having sub positions like travel insurance from – to.

Some time ago this was more related to “serious” systems like banking and amongst other assumptions also storage space was weighted. Nowadays Internet of things, self-driving cars etc coming in, the challenges of fast and easy operating with time periods have come into daily life. Eg, what was the behavior of room temperature when heater temperature was increasing and fridge temperature decreasing?

Historically updating was much more used. Like when you logged in a system, the attribute ‘last_successful_login’ was updated.

Nowadays in line with unlimited storage and high performance databases each login is treated as an event and logged as a new event with a timestamp, so system owner can do historical tracking which daytime are you active most often, is your login activity count increasing or decreasing.

Time Series database growing popularity 

Paradigm switch to data accumulating combined with desire to use the data and support of this desire is the answer why time series approach and databases have experienced kind of boost within latest decade for many areas like

  • monitoring software systems: virtual machines growing popularity, services, applications
  • monitoring physical systems: equipment, connected devices, homes, bodies
  • asset tracking applications: vehicles, trucks, packages delivered
  • financial systems: cryptocurrencies, stock prices
  • tracking applications: customer interaction data
  • Business Intelligence tools: key metrics as well as overall state of the business

Time_db_ranking

(https://db-engines.com/en/ranking/time+series+dbms)

A time series database (TSDB) is optimized for handling time series data: each entry is associated with a timestamp, thus it contains data for each point of time. Trivialized example to show the idea:

21-OCT-2017: ticket 12345 valid
22-OCT-2017: ticket 12345 valid
23-OCT-2017: ticket 12345 valid
24-OCT-2017: ticket 12345 valid

instead of classics

ticket 12345 valid_from 21-OCT-2017 valid_to 24-OCT-2017

Better example would be a pulse measurement once per a second.

  1. Each measurement is inserted as a new data entry (well, there might be use case to update or overwrite previous record but, let’s be real, who does that nowadays?)
  2. The data arrives in time order and are stored in time order
  3. Time-intervals can be either regular (as I used once per 1 second) or irregular
  4. Data amount is growing very, very fast (and nobody has neither motivation, nor courage to clear history)

So we can define time-series data as data set which represents how something – a measurement, process etc changes over time. Price changing over time might be a price curve. Energy consumption within a period might be a load profile. Logging temperature values might be a temperature trace.

Time series data querying

TSDB concept queries are specialized to time querying like

  • language near to natural, like average time per minute could be ‘group by time (1 minute)’
  • flexible built-in time aggregations – per second, minute, hour…
  • easy comparing to previous record (in RDBMS we use different workarounds like LAG, OFFSET or querying previous ID by complex calculations)
  • joining by time series automatically like SELECT orders_per_hour.count / errors_per_hour.count from orders_per_hour INNER JOIN errors_per_hour.

RDBMS

In Relational dabatases developers use to set a lot of data integrity controls

  • from error messages in input forms to checking by trigger before save in database,
  • from snapshotting at time moments like end of the month till regular controls if this type of data already exist in data warehouse.

If controls find, eg, two valid documents for a day or a day without any valid document, they automatically create incident and assign to data stewards for investigation as well as may perform any other business rules like marking both documents to ‘invalid’ state or moving them to quarantine zone.

I know a RDBMS DWH where every night batch processes scan all key data and set indicators like ‘data valid today Y/N’ or ‘the most up to date version indicator Y/N’. then instead of time intervals SQL queries use them like

select salary 
from annexes 
where employee_id = 1717 
and top_version_indicator=’Y’

In TSBD instead of that you would query something like

select employee_name / annex_salary 
from employees 
INNER JOIN annexes

High risk of wrong query

Amongst other limitations of RDBMS traditional approach start_date + end_date requires high level of accuracy as it is so easy to build a query which selects wrong data set. Just forget a condition or use > instead of >=…

select employee.name, annex.salary
from employees, contracts, annexes
where employees.employee_id = contracts.employee_id
and contracts.contract_id = annex.contracts_id
and contracts.start_date = (select max(start_date) from contracts2 
                            where contracts2.employee_id = contracts.employee_id)
and contracts.end_date >= sysdate
and annex.start_date >= contracts.start_date
and (annex.end_date is null or  …

I have seen so many wrong this type of queries for many reasons

  • one date truncated to day and the other to minute, thus equality never exists if developer forgets TRUNC
  • date stored in different formats and developer forgets using TO_DATE
  • different convention is the end date inclusive or not – new developers could not even imagine in their worst nightmares that this system stores end date as non-inclusive and they must use < end_date instead of <= end_date
  • when start date equals end date – developers use to use and end_date > start_date
  • some leave NULL if end date unknown, some set to 01-JAN-3000, some to 31-DEC-2500 etc. Some have a total chaos. It is easy to overlook these plugs in queries and frontend and print a ticket valid till 01-JAN-3000
  • different time zones (a general suggestion is to store the data in a universal time and then translate it to the time of the user. There are opposite approaches also, storing the time of submission and the time zone it was submitted in)
  • data sometimes written in database in the moment they appear and sometimes later. Some developers may unreasonable rely that data always are written in the moment they appear.

A good and documented architecture of database and accurate analyst – developer are high valued. You might imagine, why. Who wants business key data presented as a result of wrong query?

Disclaimer

This blog is solely my personal reflections.
Any link I share and any piece I write is my interpretation and may be my added value by googling to understand the topic better.
This is neither a formal review nor requested feedback and not a complete study material.

Big Data: basics of wide column store (column family) databases


Column family databases are designed for very, very large volumes of data where speed is crucial (millions of processed records per second and volume is terabytes – petabytes – …) such as performing

  • Analytics – logfiles, scientific, stock trends etc
  • Searching (like googling)
  • Social networking
  • Applications geographically distributed over multiple data centers

One of use cases – Facebook uses HBase for its messaging platform. Other popular databases (https://db-engines.com/en/ranking/wide+column+store):

Column-family_ranking_Oct2017

Wide column store is a sub-type of key-value database. It stores the data of a table not record after record but column by column. Actually the concept is interesting:

Traditional row based table:

Cats

ID, name, breed, colour, animal
1:picadilla, burmese, brown, null
2:murmor, siamese, null, cat
3:fred, null, grey, kitten

The column store stores columns together as ID and value, like this:
Cats.Name 1:picadilla,2:murmor,3:fred
Cats.Breed 1:burmese,2:siamese
Cats.Colour 1:brown,3:grey
Cats.Animal 2:cat,3:kitten

As you see, you anytime can easily add a new column like vaccination of Fred:

Cats.Vaccination 3:20-oct-2017

Or add a Date of birth for Picadilla and Fred

Cats.DOB 1:02-jul-2015,3:17-dec-2014

In a traditional table you should define the table structure before. If you add a column later, you add this column for the whole row like:

Table-Cats

Within Wide column store columns are created as needed when sending data to the database. Hence a record can have billions of columns and each record may have different set of columns.

Columns are grouped into column groups – families. Rule of thumbs are

  • to group into a family columns frequently used together,
  • to have a few families and unlimited number of columns.

Each row in the column family has a unique identifier key, like we had 1,2,3. These unique keys might be the ones you sometimes see in URLs like xEWfvS1-ffrEf-q4m. Or timestamps, or any other unique value.

To speed up querying, also derived data are stored, not calculated on fly. For example, store for each cat also average chicken liver amount eaten per day, per week, or weight of eaten food difference between yesterday and today. Or length of its tail proportion to length of its ears. Or any other information (see, how the data amount to be stored is growing?). Thus the time is saved – instead of calculations a very fast lookup by key is performed.

Should ‘Murmor, the son of a great Catapurr, born in tundra when the Sun was high‘ be stored as one string or by each word in a separate column? It depends on usecases. If you are expect database to query on any of these like ‘how many cats were born in tundra’ or ‘how many times we have word ‘the’ used in names’ then you should split them. If this is just a string then store it as a string in one column.

Joins are not used in wide column stores. Instead of that data denormalisation is used. If Picadilla favorite food  Chicken is the same as Murmor’s, then both Picadilla and Murmor will have a value ‘Chicken’ stored in their data. There will be no reference to food ‘Chicken’ lookup or colour lookup, or breed lookup.

Column-family-Cats

Here you see JSON notation for Cats family:

JSON-Cats

The columns themselves may store columns. Then is called Supercolumn family. However the more complex data structure you choose the harder it is to parse and process. Simplicity is the winning strategy of having advantage of column family databases.

Here you see JSON storing doctor checkups for Murmor:

JSON-Cats-superfamily

I hope you are as excited as I am. Magic behind ‘Big Data’ slowly reveals. No magic. Only programming :) 

By the way, here is a nice example how a tweet looks like stored in JSON. Beautiful tweets you see in Twitter is nothing else as end-user frontend programming, based on retrieving,  parsing and visually displaying these JSONs.
Disclaimer

This blog is solely my personal reflections.
Any link I share and any piece I write is my interpretation and may be my added value by googling to understand the topic better.
This is neither a formal review nor requested feedback and not a complete study material.

Big Data: basics of document oriented databases


One of the most important concept of NoSQL as the term ‘document’ can be treated in a very broad way: as well as my passport as this blog entry.

Use cases of document oriented databases:

  • Storing log files
  • Storing high volume of different data coming in – eg, one machine is measuring rotations per minute and produces CSV, and the other one measures temperature and produces XML, and yet the one keeps track of rejected operations and produces fixed length files
  • Efficient storing. For example, you have 30 attributes in your user profile like ‘date of birth’, ‘preferred music’, ‘favorite sport’ etc. One of users might have provided only date, the other only sport etc. You do not have to store the whole structure for each user telling ‘date of birth’ and ‘preferred music’ not provided (like you would store NULL or ‘n/a’ in RDBMS table structure). You just store the data you have: user1 ‘favorite sport’.
  • Storing blogs and articles with comments and likes
  • Storing business data where searching by metadata and content is crucial
  • Storing documents which structure can be changed any time – eg, you can easily add a new feature like emotions in your blog platform because you do not have to redefine the whole schema
  • Store new types of documents. You were storing only cats but today you can start storing and querying also dogs, trees, galaxies and stationery
  • Write operation works very fast as DOD have no RDBMS transaction and locking mechanisms overhead
  • Unlimited increase of database size since documents are key value pairs with document id being the key and the document being the value.

The idea of DOD is to provide a scalable framework for storing, inserting, querying and retrieving and updating (at single document level) unlimited amount of self-describing structured or semi-structured data, called “document”. Part of data is the document content itself and part is data about data.

Teacher used MongoDB as example and you see why (https://db-engines.com/en/ranking/document+store). Yellow you see Latvian team’ produced Clusterpoint:

document_db_ranking

Usually documents are stored in JSON or XML or binary like PDF and MS Word, Excel (eg, MongoDB and CouchDB uses JSON). Each document has unique ID and can have its own structure. There is no predefined schema. However we should understand that document databases are not designed to fit anything. Eg, these databases are not the best for deep nested data because cannot search them effectively.

As I am SQL person, here comes my survival kit (https://www.slideshare.net/fabiofumarola1/9-document-oriented-databases):

RDBMS_docdb_terminology

Relations among data items can be represented in two ways: referencing and embedding. Which one better? Hah, this is The Question any developer and any architect has a lot of pain and lots of guidelines are written and tons of stackoverflow.com posts. More art than a science. Each has pros and cons. Good news is that you can always change your mind. This is one of reasons why I love programming: I can play a lot. If I were surgeon it would be much harder to recompile.

Referencing to food stored in another document:

{
 _id: cat_1,
 name: “Picadilla”,
 colour: “brown”,
 food: “catfood_123”,
 amount: 2,
 dateofbirth: “10-OCT-2010”
}
{
 _id: catfood_123,
 name: “Tasty Chicken Liver”,
 producer: “Catty Food Inc.”,
 address: “Wildcat Boulevard 17”
}

Embedding food data in single document:

Notice that food has no ID itself – the _id field is a required field of the parent document, and is typically not necessary for embedded documents. You can add an _id field if you want.

{
 _id: cat_1,
 name: “Picadilla”,
 colour: “brown”,
 food:
   {
    name: “Tasty Chicken Liver”,
    producer: “Catty Food Inc.”,
    address: “Wildcat Boulevard 17”
   }
 amount: 2,
 dateofbirth: “10-OCT-2010”
}

Some ideas collected about referencing vs embedding:

  • the more that you keep in a single document the better – easy to query
  • any data that is not useful apart from its parent document definitely should be part of the same document
  • separate data into its own collection that are meant to be referred to from multiple places
  • embed is good if you have one-to-one or one-to-many relationships, and reference is good if you have many-to-many relationships
  • embedded documents are easy to retrieve (as everything stored there). When querying by parts of them, limitations exist, like sorting limited for insertion order
  • to my surprise I am reading that no big differences for inserts and updates speed

Consistency

When you design your schema consider how you will keep your data consistent. Changes to a single document are atomic (complete operation guaranteed), but, when updating multiple documents, it is likely that in a moment of time address of the same Cat food producer may differ amongst cats (NB: but there are a few databases like Clusterpoint which can handle multiple document updates in a transaction). In general, there is no way to lock a record on the server. The only way is you can build into the client’s logic to lock a field.

Remember, NoSQL systems are by desing support BASE, not ACID transactions. It is normal and real that at a moment of time you may see different address of food providers – or different comment content, or different views count.

My favorite example is Candy Crush daily free booster. If I spin it on a tablet and later try on a phone, I get ‘come tomorrow’. But if I spin on all the devices at once then I get a booster in each of devices #lifehack. In RDBMS transaction control mechanism would guarantee that once spinned you may not repeat it.

Very powerful querying

Documents can be queried by any their attributes like

{
 name = “Picadilla”
 colour: [“brown”, “amber”]
}

The querying language is powerful and not obvious, even if I am guru of SQL querying. It would take a while to learn it. Here is nice material of SQL mapped to MongoDB queries.

As usual, each query should be checked its speed before going live. Smilar to RDBMS, nice feature is call ‘explain’ for a query to see what is database performing when running the query – which index its using etc.

MongoDB_SQL2

Inserting new records

Again MongoDB as example.  Insert one:

db.inventory.insertOne(
   { item: "catfood", qty: 10, tags: ["chicken”, “liver"], ingredients: { water: 50, meat: 30, fat: 30, unit:"pct" } }
 )

Insert many:

db.inventory.insertMany([
item: "catfood", qty: 10, tags: ["chicken”, “liver"], ingredients: { water: 50, meat: 30, fat: 30, unit:"pct" } }
item: "dogfood", qty: 23, tags: ["beef"], ingredients: { water: 40, meat: 20, fat: 40, unit:"pct" } }
item: "kittenfood", qty: 3, tags: ["turkey", “fillet”], ingredients: { water: 55, meat: 30, fat: 25, unit:"pct" } }
])

Updating

Nice reason to learn upsert clause: if set to true, creates a new document in case if no document matches the query criteria. multi means if matching documents exist, the operation updates all matching documents.

db.cats.update( { "name": "Meowcha"},
   { "colour": ["brown", "white", "black"] },
   { upsert: true, multi: true } )

Deleting

We set deletion criteria and remove matching documents. Eg, the following operation removes the first document from the collection cats where amount is greater than 2:

db.cats.remove( { amount: { $gt: 2 } }, true )

Well, I have a had a look on the very, very basics. Can I apply for a DOD or MongoDB expert role now? No :) But I can honestly say I now know much more I knew a month ago and I definitely would not be afraid if told in my project ‘we are going to start using document oriented database tomorrow’.

Disclaimer
This blog is solely my personal reflections.
Any link I share and any piece I write is my interpretation and may be my added value by googling to understand the topic better.
This is neither a formal review nor requested feedback and not a complete study material.

Big Data: some of universal file formats


All the data – this blog, Facebook messages, comments, Linkedin articles, anything – has to be stored somewhere somehow. How? It depends (here you can see how a tweet looks like in JSON format) but there are some universal formats.

Besides writing my notes here I am going to prove here it is possible to start and learn. You do not need any servers, any installs to learn XML querying – just google for online XPATH test or online XQUERY or online JSON query and go, do, test, learn.

Sometimes I see young girls wasting their life being bored at receptions or empty shops and sitting at a computer with Solitaire or gossip page open and I think – if I were them I swear I would learn programming online every free minute I have! When I was studying we had to sit in libraries and subscribe in advance for hour a day accessing mainframe. No excuses nowadays, guys!

XML

This is one of The Formats you should know when woken up 3AM because a lot of Big Data databases store data in XML format. Both XML and JSON (see below) are human-readable and machine-readable plain text file formats.

Database management systems, whose internal data model corresponds to XML documents, are called Native XML DBMS and they claim to use the full power of XML: represent hierarchical data and support XML-specific query languages ​​such as XPath, XQuery or XSLT.

NB: Native XML DBMS do not necessarily store data as XML documents, they can use other formats for better efficiency.

Databases which use other data models like relational and are capable of storing XML documents, are called XML-enabled DBMS.

Current ranking of native XML databases: https://db-engines.com/en/ranking/native+xml+dbms

NativeXMLDB_ranking_Oct2017

Lesson learned with self-made XMLs

XML data values have beginning and end, and are separated by tags, you know –

XML example

Many years ago, I was working as a designer of XML files for data exchange. We were young and enchanted by the unlimited power of any-structure container format and we used very long tags. Our intentions were good – human readable plain text for fixed orderforms, like [MozzarellaWithFourCheesesPizzaPriceBeforeTaxesTipsNotIncludedCurrencyLVL]1.17[/MozzarellaWithFourCheesesPizzaPriceBeforeTaxesTipsNotIncludedCurrencyLVL].

We were to XMLionize hundreds of documents and do it very fast, so we worked like a fabrics.

We did it. But… What we got was:

  • Storage space consuming documents
  • Network traffic
  • Quite funny software code parsing there wondertags
  • The same business term and tag called in many variations like Pizza, Pica, Picca
  • Grammar errors in tags confusing users like MozcarelaWihtSieru
  • Mixed language and translation errors in tags like PicaArCheese
  • At a glance easy XML readability was misleading when tag became inconsistent with value
  • Documentation was not consistent, incl. curiosities when writers corrected grammar in tags in Word docs (thinking they are doing great work)
  • Unmaintainable structure – see the example with LVL in tag and ‘four cheeses’ – recipes do change

My lessons learned –

  • short and neutral tags
  • create structure using hierarchy, not tag names
  • include version attribute in the beginning of file
  • follow the same style (we used PascalCase), usually one of:

– Lower case    firstname All letters lower case

– Upper case    FIRSTNAME All letters upper case

– Underscore    first_name    Underscore separates words

– Pascal case   FirstName Uppercase first letter in each word

– Camel case    firstName Uppercase first letter in each word except the first

Querying XML documents

One might ask – why should we query plain text file if we can search in notepad? Answer: it is easy only on short samples. But when you have a lot of data, you will get confused it is first, second or hundredth value.

XPath language

Declarative “path like” syntax to identify and navigate nodes in an XML document. Nice web page to play online: https://www.freeformatter.com/xpath-tester.html NB: tags are case sensitive

I played a bit there using self-made simple sample FoodCalendar.

It took a while with //CatName[2]/text() until I understood that second element  – [2] means second for its parent tag, not second in list returned. And correct query what I wanted – second cat in the list – was:

(//CatName/text())[2]

All foods eaten more then 2:

//*[@Amount>2]

Count cats:

count(//Cat)

All foods containing ‘Chicken’:

//*[contains(@FoodUsed, ‘Chicken’)]

Extension for XPath is XQuery

It is much more complex language to extract and manipulate XML data and transform them into HTML, CSV, SQL, or any other text-based format. I read some manuals of one of native XML database https://exist-db.org/exist/apps/demo/examples/basic/basics.html and wrote a very simple query in XQuery online test http://videlibri.sourceforge.net/cgi-bin/xidelcgi to find what is Picadilla eating:

for $i in $catxml//Cat

where  $i//CatName=”Picadilla”

return (“CAT “, $i//CatName, “EATS”, data($i//@FoodUsed), data($i//@Amount), ” TIMES A DAY”, data($i//@Date))

and answer was

CAT

Picadilla

EATS

ChickenLiver

5

TIMES A DAY

10-OCT-2017

XQueryTest

Of course, this language is much more powerful, you can analyze data and write computation functions there. My target from playing was to see if it is possible to learn this querying, and I see – it is, just some more time needed.

JSON

Another must-have-to-know is JSON format, yet another way to store information as text only in an organized and human-readable manner. Document databases such as MongoDB use JSON documents in order to store records, just as tables and rows store records in a relational database.

JSON format files can easily be sent to and from a server, and used as a data format by any programming language.

We can store any number of properties for an object in JSON format.

It is shorter as XML, however they both have similarities.

  • Both JSON and XML are “self describing” (human readable)
  • Both JSON and XML are hierarchical (values within values)
  • Both JSON and XML can be parsed and used by lots of programming languages

Differences:

  • JSON is shorter
  • JSON is quicker to read and write
  • JSON can use arrays

and the biggest difference is that XML has to be parsed with an XML parser. JSON can be parsed by a standard JavaScript function. That supports explaining huge popularity of JSON.

JSONPath

Similarly to XPath, there is JSONPath which is a JSON query language.

I took my FoodCalendar XML and converted to JSON via https://www.freeformatter.com/xml-to-json-converter.html.

and wrote a simple query to filter all foods and dates where amount eaten is < 5

$.Cats..Meals[?(@.Amount<5)].[FoodUsed,Date]

http://jsonpath.com/

JSON_path

CSV and FIXED LENGTH FILE – universal formats for tabular data set

At least basic understanding of these universal tabular (not hierarchical) formats is crucial because a lot of NoSQL Big Data files are stored in these formats.

CSV (comma separated) – the one you should know. It will never die because of its simplicity.

CSV has become kind of industry standard, despite it has no universal standard: text file having one record on each line and each field is separated by comma (or ; or TAB or other symbol). Built-in commas (or another separator) separated by double quote. Double quote characters surrounded by double quotes etc.

List of advantages is impressive:

  • compact size – write once the column headers and then no more additional tags in data needed
  • human readable,
  • machine easy generate and easy read,
  • widely used for tabular data
  • most applications support it.

Very popular amongst MS Excel users. Used to transfer data between programs, import and export data, sometimes used as a workaround to export, then modify and import back.

Disadvantages:

  • complex data are too complex to transfer within CSV,
  • poor support of special characters,
  • no datatypes defined (text and numeric is treated the same)
  • when importing into SQL, no distinction between NULL and quotes.

As there are no universal standards, widely hit issue is new line delimiters – Linux uses one, Windows another etc.

Example of formatted XLSX file:

Excel_formatted_table

Saved As CSV:

NR,CatName,Diet,Food,Date,Amount,
1,Picadilla,,"Sausage ""The Best""",12/09/2017,1(?),"Peter, can you check, was it really only one??"
2,Murmor,Y,"Chicken,boiled ©",14-Sep-17,0.5,
3,Fred,N,"Salmon,,fresh",15.09.2017,2,

See:

  • the last comma in the first row – one column is without heading
  • first record contains NULL value for ‘Diet’, contains quotes for Food and comma in comment
  • second record contains special symbol which might (heh, will) be lost when importing to another software
  • dates still different format
  • colors lost, formatting lost

And the same open in Excel again

Cats-csv-Excel1

Double-clicked to expand columns

Cats-csv-Excel2

Fixed-length fields

As name reveals, it is an agreement that first column always has exactly X (5 or 10 or any other value) characters, the second column has exactly Y, the third has exactly Z and so on. The same for all rows.

If the value is shorter than blanks are padded with spaces or any other specified character. Padding can be done on either side or both.

When you use this format be ready to do a lot of configuration like defining each field length and even writing your own code.

I converted my cats.CSV to fixed length file (http://www.convertcsv.com/csv-to-flat-file.htm). I had to do several configuration options like field length and alignment

NR   CatName   DietFood                     Date                     Amount

1    Picadilla     Sausage "The Best"       12/09/2017               1(?)  Peter, can you check, was it really only one??

2    Murmor    Y   Chicken,boiled �         14-Sep-17                0.5

3    Fred      N   Salmon,,fresh            15.09.2017               2

And after opening in Excel –

Excel-fixed-length-file

As you see, a smarter reader software is necessary.

You might ask – hey, let’s add some data definition to the file and then file format is readable automatically by software. Why not :) it is called

DBF (database table file) format

It is a fixed length file having its data definition in the beginning of file in machine readable standardized format. There is no one universal DBF standard. Each file contains a description. Interesting to know this format but I see no reason to learn very details.

I tried to convert online my CSV to DBF but failed. Then I saved CSV to XLSX and converted XLSX to DBF.

Opening converted result with Notepad:

Cats-DBF-Notepad

Excel:

Cats-DBF-Excel

Opening DBF online (http://www.dbfopener.com/):

Cats-dbf-viewer-online

These experiments were enough to illustrate that even small and simple fixed length files need some time to be converted.

And, as you see, copyright symbol lives its own life :)

Disclaimer
This blog is solely my personal reflections.
Any link I share and any piece I write is my interpretation and may be my added value by googling to understand the topic better.
This is neither a formal review nor requested feedback and not a complete study material.

Big Data: enchanted with the idea of graph database power


Why there so many differetent database management systems? Because each of it supports the best something you need.

  • Payments 24/7 and queries like calculating average price of TOP 5 most sold goods? – choose relational database and enjoy its built-ins transaction support and SQL

Relational database: predefined tables where one document usually is split amongst tables and a SQL query must be written to join parts to be retrieved as a piece set for “document”

  • Building an e-shop shopping cart? -key value store and retrieve/write cart data by ID

Key-value store: data value is unknown black box for store and is located by its key and retrieved very fast.

  • Storing blog posts or messages? -document oriented database

Document-oriented store: similar to KV store, but document oriented database knows predefined metadata about internal structure of the document. The document content itself may be anything autonomous – MS Word, XML, JSON, binary etc, but database engine uses some structure for organizing documents, providing security, or other implementation. In contrast to relational databases, document is stored as singular object. (Next lecture will be about them, so expect a blog post)

  • Navigate user from point A to point B? Social networking? – graph database.

Graph database: networking. Database is collection of nodes and edges. Each node represents an entity (such as a cat or person or product or business) and each edge represents a connection or relationship between two nodes – likes, follows, blocks, ….

NoSQL graph database does not need its schema re-defined before adding new data – neither relations, nor data itself. You can extend the network any direction – billions of cats, ups, data items. You can add cats, farms, persons, foods, cars, you can add their likes, dislikes, hates, reads the same, sister of, attends the same lunch, checked in the same place, just anything.

Picadilla (likes) Fred. Murmor (hates) Minko. Picadilla (eats together with) Minko. Fred (meows) at Amber. Murmor (sleep in the same room as) Amber.

You see, as Murmor hates Minko, he better avoid Picadilla. Amber also should be cautious of Picadilla as she likes Fred, which meows at Amber, so there is a chance they will meow both at Amber.

Next day you add more observations.

Minko (likes) Murmor. It increases chance that he will hate Minko and avoid Picadilla.

As more data you have as better you can trace connections (King of the World). More paths and usability of paths you can find – just imagine the power. Graph databases are meant for that. And Facebook… what a set of queries I could write there…. mmmmm….

I felt in love when realised we can query graph database using specialized query language.

Who likes Fred? Which are friends of those who hate Minko? What is common between Picadilla and Murmor? Which cats cant’t be in one room? How many cats in average like one cat?

Hinghest ranking is Neo4j database. Its graph query language is CYPHER.

To be honest, CYPHER language is human readable and seems quite easy to learn.

MATCH (cat) –[:likes] -> (person) where cat.name=’Picadilla’ RETURN person

I googled samples – https://neo4j.com/developer/cypher-query-language/

Find Someone in your Network Who Can Help You Learn Neo4j

MATCH (you {name:"You"})
MATCH (expert)-[:WORKED_WITH]->(db:Database {name:"Neo4j"})
MATCH path = shortestPath( (you)-[:FRIEND*..5]-(expert) )
RETURN db,expert,path

Cast of movies starting with “T”)

MATCH (actor:Person)-[:ACTED_IN]->(movie:Movie)
WHERE movie.title STARTS WITH "T"
RETURN movie.title AS title, collect(actor.name) AS cast
ORDER BY title ASC LIMIT 10;

It seems matter of mindset and syntax if you have skills in SQL querying. I like graph databases.

Disclaimer
This blog is solely my personal reflections.kep
Any link I share and any piece I write is my interpretation and may be my added value by googling to understand the topic better.
This is neither a formal review nor requested feedback and not a complete study material.

Big Data: learning key-value store basics


Are you ever wondering how do Facebook manages 20 million reads per second? Every 60 seconds 510 000 comments, 293 000 statuses updated, 136 000 photos uploaded. Imagine, you are one of a milliard active there and it works fast like you are one in the whole Universe! HOW?!?! (d’oh, when I understand, many cats will be needed to explain)

Big Data studies are (slowly) opening a whole new world for me. On my SQL planet query (well, quite complex analytical one like ‘calculate income within last 30 years generated by users who have complained and whose complaints were declined but they have still returned as customers and used the service more than average’) runs 15 minutes to hour.

Key-value concept is a very flexible data storing and retrieving approach used in NoSQL systems. Key-value store stores key-value pairs. Values are identified via key and accessed via direct request to the object in memory or on disk (no RBMDS layer, no overhead, no relationship among other pairs, no control if value matches predefined format etc).

Being experienced in relational databases, I somehow expected that somewhere is a definition like key is number and value is text. No, no, no. There is no defined schema in key-value store. They have just pair of fields – a key and the value. This is called content-agnostic database –  store anything you want either data itself or pointer to data – from JSON to XML, from HTML to images, from log files to chat history, from books to videos. No need to learn a special data query language, and it is easy to move data to another system because of this simplicity.

There are some basic KV concepts:

  • You can find the value only by its key – and find very fast. (when system provides fast access to data operations, it is called low latency system – you might see this term when googling KV). Key structure example: userID_messageID
  • The values are opaque (they aren’t self-descriptive), the key-value store doesn’t know anything about values (like courier, delivering something to your address, does not know content). Application (not the key-value store but application – like Instagram frontend) has complete control over performing operations based on value content – like you might decide open the pack with a knife or a sword, or maybe it is a flower bucket or throw the content away.
  • You always retrieve full value from key-value store. You cannot filter or control value returned. What do you do with this value – it’s your application business. Of course, application can read the binary content and decode to text and then filter content out of it.
  • Data access is performed by “simple” get, put and delete commands to key-value store. As all the other operations are performed by applications, the key-value store gets in general one request to read, one request to write: read when application retrieves value and write when user changes are done in your application – eg, cart in e-shop – operations are not written on disk in key-value store each time you add a product or modify desired amount – the data reside within application cache.

Cat Passport Key Value store

Hmm. What should I use for key and value? Relational database modelling is descriptive: I know what objects I have within business and build model – table CATS (CatID number, Name VARCHAR2(30), ,,,,), table GENDERS, table BREEDS.

Within Key-Value store it is crucial to have the key be usable for retrieving data. I must think ‘what I want to know’ instead of relational approach ‘describe what I know’.

Design of keys and values 

I could choose to store my cat data ahyhow I want (remember, value will be stored binary 0028 e8e9 00fc 5cbb… and only application decodes it to text after retrieving from store):

Key: Picadilla

Value: Born:20150921;Breed:Burma;Color:#FFBF00;Gender:1;Photo:IMG_20170925_121432.JPG

And I can decide store with date of birth and store in another format:

Key: 20150921

Value:(Name)Picadilla(/)(Breed)Burma(/)(Color)amber(/)(Gender)Female(/)(Photo)IMG_20170925_121432.JPG(/)

And I can decide store with my name as a key and store in yet another format:

Key: Burma

Value:N=Picadilla|B=21-SEP-2015|C=255,191,0|G=F

And I can decide store with random generated number as a key

Key:6756970977876576789097

Or URL

Key:https://mysite.cats.cc/thebestcats/Picadilla.htm

I can build my software read these attributes and show name as large red, breed as blue etc. I can add latest vaccination date, free form comments and save it in key-value store. If I add vaccination to Picadilla, then the are no checks if I add the vaccination date also to Murmor. Freedom of values.

Often JSON format is used for values structure describing – I will tell about it someday a bit.

P.S. Of course, in Facebook etc never there never will be key like ‘VitaKarnite’ in KV store. They use keys either random unique identifiers or calculated by hash functions from something like Use rID and Username.

I believe any of large photo storing system stores photos as key-value pairs. I am pretty sure these pairs do not contain user name or any other additional potentially changing data. I could assume that uploading time might be stored inside of value. I think there is kind of combination where tables store metadata like user name, surname, last login, relationship to friends. Also there might be table UserPhotos storing UserID and unique autogenerated PhotoID, and then Key-Value pair would be PhotoID and pointer to file location. When new photo uploaded, new metadata record (UserID plus PhotoID) generated and key-value pair added in key-value store.

I had a look on most popular key-value databases and googled  usecases.

  • Near everywhere you will find this example – cart in e-shop
  • User preference and profile stores
  • Product recommendations; latest items viewed on a retailer website drive future customer product recommendations
  • Ad servicing; customer shopping habits result in customized ads, coupons, etc. for each customer in real-time

It’s enough for today despite I am behind learning schedule, have graph databases to learn yet and tomorrow is next lecture already.

P.S. Instead of counting sheep I design approaches for CandyCrush – how would I store the board layout, record moves, build controls, define attention loss detection logic – you know when you are losing patience suddenly 5 color bombs there. I am figuring out also user characteristics metrics from their CandyCrush history. I am sure I could pull out a lot of interesting things :) and I am even more sure a lot of companies already do. I’d eat my hat if banks do not profile you by the style you use internetbank.

Disclaimer
This blog is solely my personal reflections.kep
Any link I share and any piece I write is my interpretation and may be my added value by googling to understand the topic better.
This is neither a formal review nor requested feedback and not a complete study material.

Big Data: domesticating the MapReduce wildcat


MapReduce – simple, yet extremely powerful technique or even paradigm. This concept initially was introduced by Google and nowadays widely used in Big Data systems. Eg, Apache Hadoop.

To be honest, it took some time for me to understand, despite well designed study materials. Because when you start thinking you have so many what-if questions. The hardest nut was data cleaning because samples I googled use unbelievably clean data like ‘word count in a book’. Guys, show me please book where w0rdzz a l1k3 ^|^hee$e and I’ll be happy to see your usable results. Like if they showed you only a paper plane folding and nothing more while you a hoping to learn about rocket ship. At least its paper model.

That’s why this blog is for – I document my learning journey.

Back to MapReduce now. It does not change original data in any way. It performs only logical operations and calculations on the very large amount of data stored on many different servers. Operations to support user answers like:

  • which is the longest word in these 10 books?
  • which is the most popular word in the 100 thickest books in this bookshop?
  • what percentage of words contains both r and n in the city library?
  • how many times vowels are used more than consonants in Indo-European languages?
  • which is the longest word sequence common between Twilight Saga and Harry Potter?
  • which of my, Alexa and Max common friends have commented my public posts about cats more that they comment post about cats in average?
  • what is the proportion by each country its twitter users are tweeting about their country football team vs their direct neighbour country?

I’ll note – do all that on terabytes and petabytes of data and do that fast. Wear your Big Data hat on. You could count words in one medium-size book alone but your life would be too short to count in a library, ten libraries.

Ahh, books… You know I am limited to cats so we have a Cat farm instead. We are running our farm site, cat souvenirs online shop, cat shows, forums and charities, thousands of photos and people liking and commenting them.

Brief background of Cat Farm site

When we started 10 years ago it was a small hobby with articles run on one SQL server and plain text comments each limited to 254 characters. When we posted more articles, introduced forums and users started more commenting, we added a new disk to server and altered tablespace to add datafile. It was scaling-up.

After Madonna visited our Cat Farm 5 years ago, it boosted site popularity and our server and SQL could not handle the social networking features we wanted to introduce. We moved away from RDBMS to Big Cat Big Data System (BCBDS) with Hadoop file system (NB: according to study plan, lecture about it is planned later) and MapReduce framework.

There are 3 nodes in our BCBDS (3 here because we had 3 quite powerful computers – Alex, Max and we were not using them because of smartphones era). Each of nodes now store several gigabytes with user comments. As user count grows and more comments flow in, we are planning soon to add two more nodes (medium-class servers) to parallelise and improve performance. It will be scaling-out.

MapReduce Cat Example

Local newspaper has anniversary and looks for cute stuff to write. Of course, cats. They are curious:

*) which of our cats is discussed the most in our Cat Farm page comments.

*) are tri-color cats discussed more than white or foxy?

Input

Let’s face reality: our page comments are like

Mango u soo butiful;;this cat looks so fat and ugly like my cousin Fred;;ahh I love Amber;; hi my name is FRED and I am 5 years old;;what a sweety your Piccy is;;mmm this sweet-kitt am-ber looks like real amber;;is his name Mingo or Minko?;;folks there feed poorMurmor;;I wanna adopt Amber;;soo cute FrEddy;;OMG OMG murrmorr my love he looks like my Angus;;could you please shut up with your cats

Cat Farm Analyst or Programmer: Defines map function

At first, we must define what keywords – in this case – names are we looking for to map. These rules will be distributed to each node as map function to be applied on its stored data, in our case – a lot of text files.

We know names of our cats, so in this example we do not have to write complex logic for recognizing names to conclude if this site comment related to our question.

  • We set a filter: process only words Mango,Fred,Amber,Picadilla,Minko,Murrmor
  • We add a condition to ignore letter case (Fred=FRED=FrEd etc)

To improve results, we have a quick look to find some typical typos.

I was long time in doubt, what filtering and transforming of Cat names shall be part of Map and what of Reduce function? Was reading and was upset why do internet people use so perfect samples? Then I found article Top 50 MapReduce job interview questions and answers and voila! Map: … in which we specify all the complex logic/business rules/costly code.

  • We add non-letters skipping (amb-er=amber)
  • We add double-letters skipping (Piccadilla=Picadilla)

We discussed option not to count ‘amber’, but count only ‘Amber’, also maybe cut off ‘cousin Fred’, but found it too time consuming for a local newspaper request.

[Magic] Here we use the MapReduce system manual to code “Dear Node, please, for each word found satisfying these conditions return me the key-value pair: <word,count>” I’ll skip real code now because my practical skills are not good enough yet.[/Magic]

Map function is now defined. Each node will calculate zero or more key-value pairs.

Cat Farm Analyst or Programmer: Define Reduce function

Reducer function performs light-weight processing like aggregation/summation to get the desired output from the key-value pairs each of nodes have calculated. We will use two reducers: one for cat names count and the other for colours count. I believe this reduction might be done within one function also, but this is beyond my skills yet.

Function for Cat names: group by key and sum values.

Function for colours:

  • If key is ‘fred’ or ‘amber’ then add value to ‘foxy’ counter
  • If key is ‘mango’ or ‘minko’ or ‘murrmor’ then add value to ‘tri-color’ counter
  • If key is ‘picadilla’ then add value to ‘white’ counter,

Both reduce functions return the key-value pair: <word,count>. This result in a real system then might processed by user interface software, for example, to turn first letter to capital and shown using coloured large font in centre of screen.

Digress a bit: map and reduce function logic really depend on our needs and what we treat as a key. Currently key is cat name because we are looking for it. But if we would be looking for daytime when the most comments come in, then key might be minute and value might be comments count within period of this minute (1,45), (2,49), …, (1440,34). The Reduce function might be defined to do grouping by hours then.

Reduce functions defined. We are eager for the results. Lights..Camera…Go!

Framework: Split phase

MapReduce framework distributes our mapping rules function amongst nodes – mappers. Usually there is an orchestrator node set up by framework software processes.

NB: in our BCBDS nodes are storing also backup copies for other nodes data (Cat Farm is afraid page comments being unavailable or even lost). MapReduce framework’ s built-in logic automatically takes care the data not to be double (triple, …) mapped and counted, that’s why I do not write about that.

Nodes: Map phase

Each node, based on the same map function, performs its stored data mapping to key – value pair. All nodes do that in parallel.

Node1 scans its gigabytes of comments in txt files and does mapping

(fred,1)

(mango,1)

(fred,1)

(fred,1)

(amber,1)

Also, Node2 and Node3 perform the same with their stored data.

Nodes: Combine phase (sometimes called mini-reducer)

It would be waste of time and traffic if all “single” pairs would be sent as input to reduce function. So it is reasonable to do basic aggregation on nodes. Node – mapper combines the same values and the result is:

(mango,117)

(fred,568)

(amber,344)

Node2 scans its stored data and result after map phase and combine phase is

(picadilla,7)

(amber,768)

(minko,93)

Node3 scans its stored data and result after map phase and combine phase is

(murmor,76)

(amber,7)

(fred,701)

Framework: Shuffle and sort phase

Within shuffling the data are transferred from map function to reduce function. Otherwise final output is not possible as there is no data – we cannout group and sum cat names if no names provided.

I was initially assuming nodes send their results data over to some central processor which then sends the data back – and still am trying understand that paradigm: no, nodes don’t send. This is the beauty of distributed computing frameworks – their processes orchestrate the flow with internal algorithms how are the combined key-value pairs distributed over to nodes to perform reduce function (eg, it must not happen that reduce function does not add cat names count from some nodes). We will have guest lecturers later – real system architects – and I hope they will openly share details.

MapReduce framework built-in logic (framework software processes on orchestrator node) does shuffling and sorting for all the result set. It splits the result from nodes (previous role – mappers) to nodes (current role – reducers) to calculate outcomes (to perform Reduce function).

Reduce phase for Cat names count

Orchestrator arranges Node1 will reduce key-value pairs

(amber,344)

(amber,7)

(amber,768)

Node2 will

(fred,568)

(fred,701)

(mango,117)

Node3 will

(minko,93)

(murmor,76)

(picadilla,7)

Note: all ambers are on one reducer node, all freds on another. I do not know yet how it would be if one group is unproportionally large to be sent to one reducer.

Note: one careful analyst might wonder why Picadilla so unpopular. Because in coments they often write Piccy or Pica or Picady but that was not noticed when defining Map function. Yeah, keyword tuning is a real challenge within uncleaned source like comments are. Remember, this is not traditional RDBMS or data warehouse where we use to have strict data validation and cleaning rules at entry point or by a regular process. This is BIG DATA world – data just flow in.

Reduce phase for colours count

I assume here shuffling will be done differently as conditions added to nodes output. I am still learning this.

Final output

Final output of Reduce for colours is

(foxy,2388)

(tri-color,256)

(white,7)

Output of Reduce for cat names are

(amber,1119)

(fred,1269)

(mango,117)

(minko,93)

(murmor,76)

(picadilla,7)

We copy the data to Excel, remove brackets, capitalize first letters and send to newspaper. And soon we are reading article about our Farm with several fun facts:

  • people love foxy cats more than 340 times more than whites,
  • the most popular cat name in this Farm is Fred.

Folks, be careful of statistics you provide. Somebody might treat it seriously.

NB in conclusion

As we talking about exa,pexa,schmexa-bytes and parallelisation among several nodes by Map-Reduce framework, the normal question is: how to balance nodes load? It would not be OK if one node receives to calculate million words starting with ‘A’,’B’,…,’W’ and second node ten words ‘Z’ because there will be delay while waiting Node1 results due to unbalanced load.

You’ll also ask – well, and how do we decide, how many nodes should be used for Map and for Reduce phase calculations and how the key-value pairs to be distributed in the balanced way?

Hehe, that’s what Map-Reduce framework developers and architects are paid for :) our business here is to define – our key will be Cat name and value will be its count, this is our Map function, this is Reduce function, and framework’s internal business is – how to distribute these functions to nodes, how to split, shuffle, balance reducing. There is no one global standard for that.

Some of developers keep internal logic as commercial secret, some are proudly publishing whitepapers to show their system strengths. There are rumours some have patented their approach, while some are open source.

Thank you for your patience. I hope you also have more questions now :) There are key-value databases and graph databases on my learning queue now.

P.S. my application about cat autofeeding practice was accepted. Have I developed it? No. Do I have a clue how to? No. Am I afraid? No. Will I be able to do it? I hope yes.

Disclaimer
This blog is solely my personal reflections.kep
Any link I share and any piece I write is my interpretation and may be my added value by googling to understand the topic better.
This is neither a formal review nor requested feedback and not a complete study material.